Pressure Chart
The Pressure Chart display the details of your AcuRite Connection Device's barometric pressure measurements and changes over time.
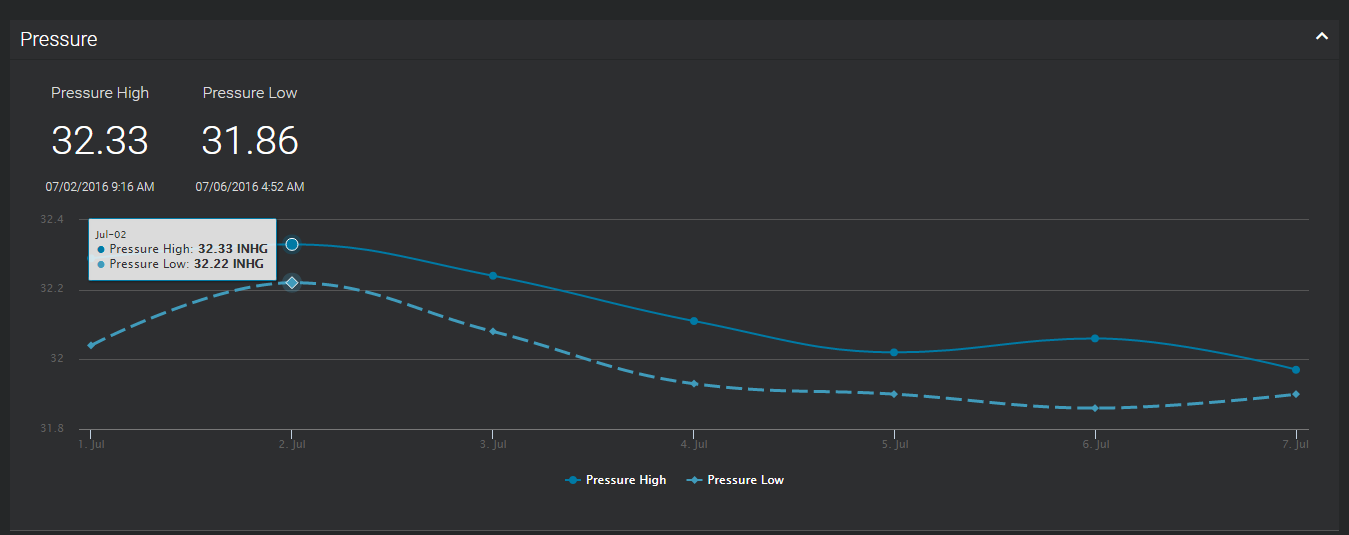
The details of the chart data displayed is provided below, along with an example of a chart.
 Pressure
Pressure, or barometric pressure, is the weight of the air at a specific location, measured in Inches of Mercury (inHg) or Hectopascals (hPa).
Pressure High - the highest Pressure measurement in the interval of time being viewed.
Pressure Low - the lowest Pressure measurement in the interval of time being viewed.
Did you know? Subtle variations in barometric pressure greatly impact the weather.
The barometric pressure trend direction can indicate potential future weather conditions.
Pressure trend:
- Rising - clearing conditions likely
- Steady - current conditions will persist
- Failing - cloudy to stormy conditions likely