Your Dashboard
Your Dashboard displays the most recent sensor readings received from an AcuRite Connection Device (AcuRite Access, smartHUB, PC Connect),
Overview
Each AcuRite Connection Device and the accounts you're following are displayed as a tab on your Dashboard. Select the tab name to view the Connection Device and its sensor readings and status.


How often is data refreshed?
Dashboard data is automatically refreshed every 5 minutes icon.
icon.
My AcuRite reading gaps may occur if a sensor is offline due to a loss of power or its wireless signal to a Connection Device has been lost, or a Connection Device’s network connection is not stable.
How to view your sensor readings
Your sensors are listed in the tab of the AcuRite Connection Device they have been added to. The readings displayed are the last sensor readings sent from the Connection Device to My AcuRite. The reading icons provide a visual indicator to easily identify the type of reading. The readings are displayed in the time zone of the Postal Code set in AcuRite Connection Device.

How often are sensor readings sent to My AcuRite?
The frequency that sensor readings are sent to My AcuRite (upload frequency) is dependent upon the type of AcuRite Connection Device.
The latest sensor reading is displayed on your Dashboard and all readings received are displayed in Charts & Details in 5 minute intervals.
AcuRite Access - the most recent received readings are uploaded to My AcuRite every 5 minutes.
Calculated reading types, such as Dew Point and Feels Like, are calculated locally by the device and uploaded to My AcuRite. Reading calculations are based on all readings taken by each sensor during each 5 minute interval.
Accumulated reading types, including rainfall,
When an AcuRite Access device is operating on battery backup power or it does not have a network (internet) connection, its readings are not sent (uploaded) to My AcuRite or Weather Underground. During battery backup use or when it does not have a network (internet) connection, the device continues to receive readings and stores up to 12 hours of readings (logged readings) in its local memory. All logged readings are sent (uploaded) to My AcuRite when its AC power or network (internet) connection is restored. Logged readings are not sent to Weather Underground.
AcuRite smartHUB - readings are uploaded to My AcuRite at the time a reading is received from an AcuRite outdoor or indoor monitoring device (sensor) by the smartHUB. The upload frequency is based on each sensors' reading frequency.
PC Connect (for use with a 5-in-1 weather station only) - the readings of a 5-in-1 Weather Station are sent to PC Connect by way of the USB connection between the Indoor Display and your computer. Readings are uploaded to My AcuRite over your computer's network (internet) connection. For PC Connect use, My AcuRite sharing must be enabled in the PC Connect software. The upload frequency is based on each of the 5-in-1 sensors' reading frequency.
How to view the status of a sensor
The status of a sensor includes its battery level and its wireless signal strength to its Connection Device, and the date and time My AcuRite received the last sensor reading.
The status bar is located to the left of the its name,. Select the status bar to view additional status details.
Green - everything is operating as expected.
Yellow - a condition may need your attention soon and should be looked into.
Red - a condition does need your attention now. Offline indicates a reading from the sensor has not been received for more than two (2) hours and a Loss of Signal alert has been activated.
How to view readings in charts
The chart on the Dashboard displays the last 12 hours of readings in one hour intervals for the selected reading type.
- To view the details of each hourly reading, hover over a data point.
- To change the trend chart displayed, select the displayed name of the reading type.
- To view the readings in a detailed chart or to export the readings, select the current sensor reading - which automatically opens the Charts & Details page for the sensor.
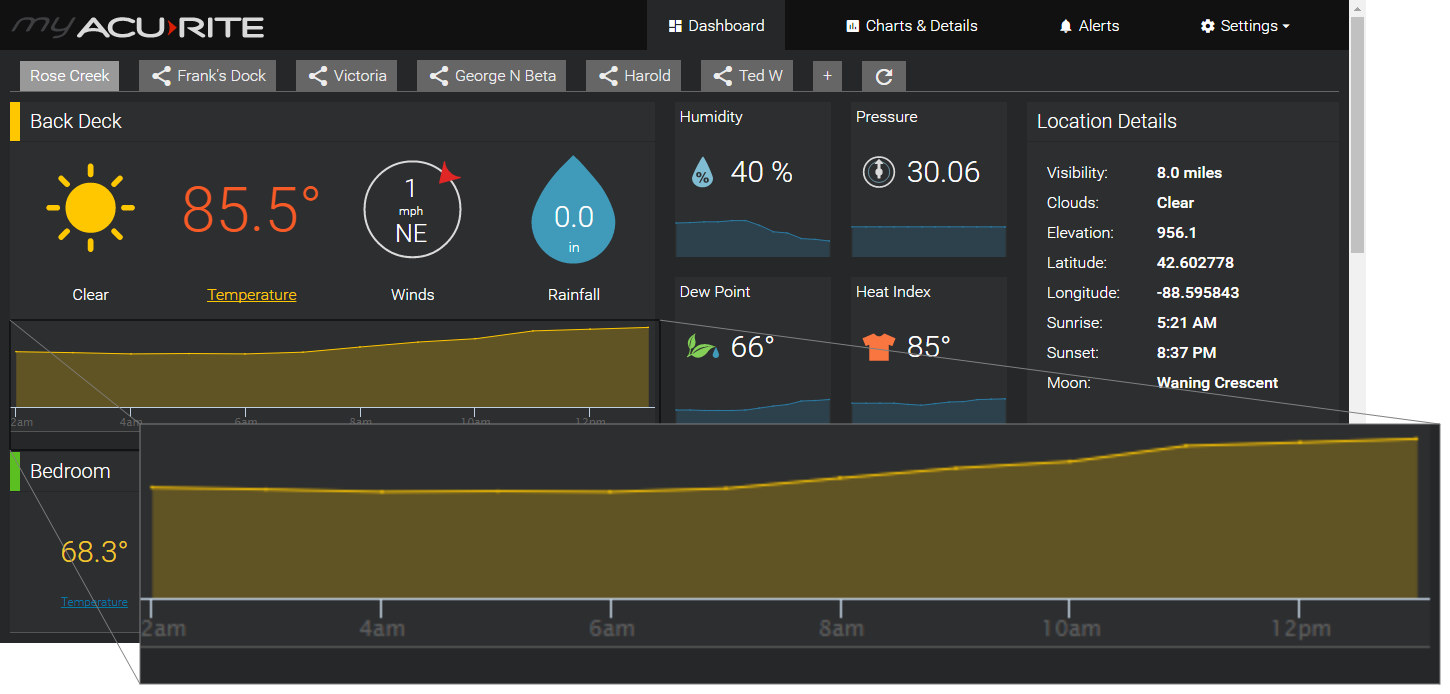
How to view the current weather condition
The Current Weather Condition is based on the address location or Postal Code set in the profile of an AcuRite Connection Device. This information is provided by our partner Dark Sky.
The weather icons provide useful information at a glimpse - clearly distinguishing the current conditions such as sunny, rainy, stormy, cloudy, and more.

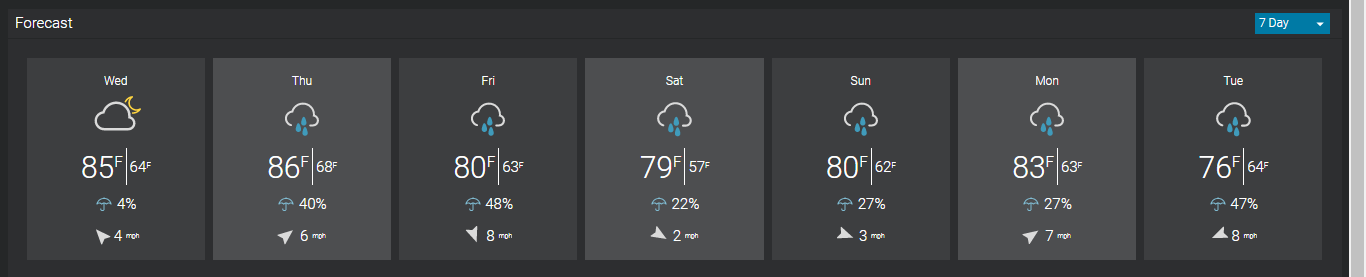
How to view your forecast
Your local Forecast is provided by our partner Dark Sky. The Forecast is based on the address location or Postal Code set in the profile of an AcuRite Connection Device.
You can set the forecast to be displayed as a 7 Day (default) or 12 hour forecast.
7 Day - displays the current day and the following six day forecast.
12 Hour - displays the next 12 hour forecast starting at the top of the next hour. For example, if the current time is 10:15 am the first hour displayed in the 12-hour forecast is 11:00 am.